6
Know-how makes the difference
B-6140-UK-01-2014-REV. A
An
Company
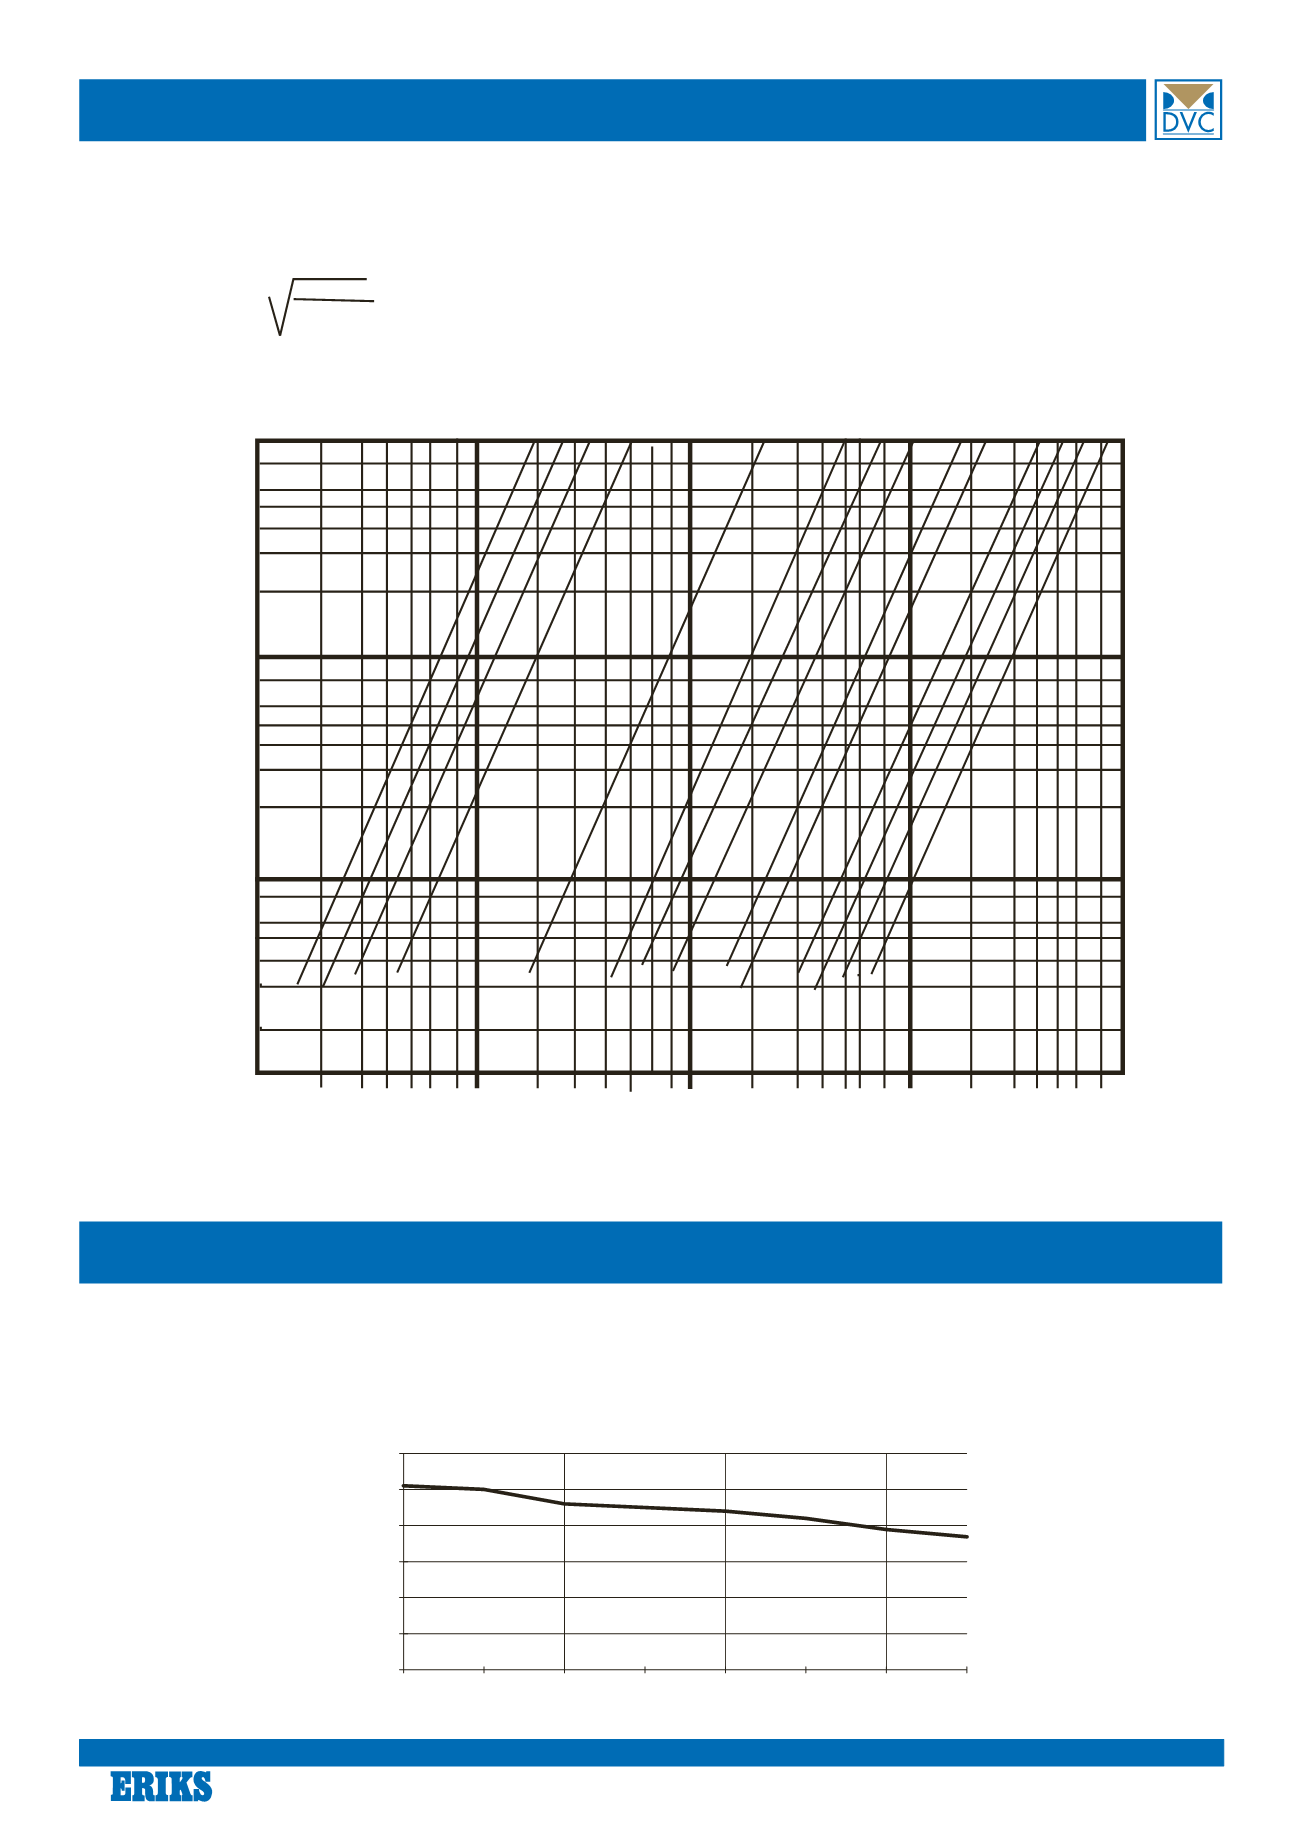
Head losses
Pressure / temperature chart
0
1 0
2 0
3 0
4 0
5 0
6 0
0
5 0
1 0 0
1 5 0
2 0 0
2 5 0
3 0 0
3 5 0
P/T [bar/˚C]
Nitrile: Tmax: 80
0
C
EPDM: Tmax: 120
0
C
Viton: Tmax: 170
0
C
PTFE: Tmax: 200
0
C
Head losses chart refers to water at 20 ˚C.
For different mediums the equivalent water flow can be found by the following relationship :
Qe = Q d
ove: Qe =
equivalent water flow
[m
3
/h]
1000
Q =
medium flow at working conditions
[m
3
/h]
d =
medium density
[kg/m
3
]
notes: - w.c.m. = water column meter
2 4 6 10 20 40 60 100 200 400 600 1000
m
3
/h
50 80 100 150 250 350 450
DN
40 65
125 200 300 400 500
10
6
m.c.a.
w.c.m.
2
1
0,6
0,2
0,1
0,06
0,02


